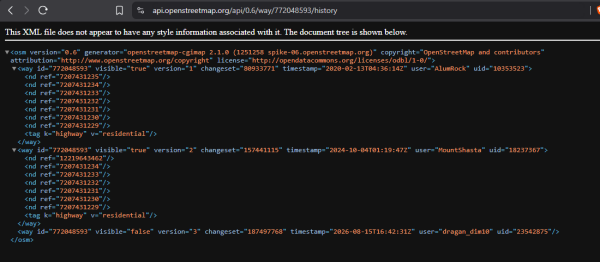
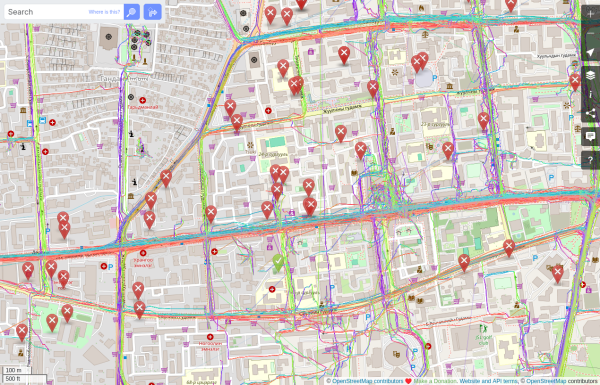
One thing that usually worries us as OpenStreetMap mappers is having our hard work deleted by someone else, either accidentally or intentionally.

Digital maps have become an important part of modern web applications. From finding businesses and transport routes to understanding geographic patterns, mapping technologies allow users to interact with information based on location.
OpenStreetMap is particularly interesting because its map data is created and maintained by a global community. The OpenStreetMap website also provides user diaries where contributors can share experiences, technical topics, mapping activities, and community projects.
Why Location Data Matters
Location can add useful context to many types of digital information.
A web application can associate information with:
Cities Regions Roads Buildings Sports venues Businesses Public facilities Transport networks
For example, a sports-information application could use geographic data to identify the locations of stadiums and other sporting facilities.
Mapping Sports Venues
Sports data and geographic data can be combined to create interesting applications.
A simple dataset might contain:
Field Description Venue Name of the sports venue City Location of the venue Country Country where it is located Latitude Geographic latitude Longitude Geographic longitude Sport Sport associated with the venue
This information could then be displayed on an interactive map.
OpenStreetMap Data
OpenStreetMap provides geographic data that can be used in many mapping applications, subject to its data licence and attribution requirements.
A developer can use map data to create applications for exploring roads, buildings, landmarks, transportation infrastructure, and other mapped features.
The OpenStreetMap ecosystem also provides tools and editors that allow contributors to improve geographic information.
A Simple Web Application Concept
A location-based sports application could follow this structure:
Sports Data ↓ Venue Database ↓ Geographic Coordinates ↓ Mapping API / Map Library ↓ Interactive Web Map
A user could select a sport and view relevant venues on a map.
Using Geographic Coordinates
Each venue can be represented using latitude and longitude.
For example:
const venue = { name: “Example Stadium”, latitude: 19.0760, longitude: 72.8777 };
A mapping library can then use these coordinates to place a marker on an interactive map.
Combining Data and Maps
The combination of structured data and maps can create useful visualizations.
For example, a project could display:
Sports venues by city Number of venues by region Distribution of facilities Distance between venues Transportation connections Geographic coverage
These visualizations can help users understand geographic patterns that are difficult to see in a conventional table.
Responsible Use of Geographic Information
When building location-based applications, developers should also consider privacy and accuracy.
Personal addresses or other sensitive location information should not be published without an appropriate reason and permission.
For public mapping projects, contributors should focus on accurate geographic information and follow OpenStreetMap’s community and contribution guidelines.
Learning From OpenStreetMap
OpenStreetMap provides an interesting environment for developers who want to learn about:
Geographic information systems Open data Mapping APIs Web development Data visualization Community mapping Location-based applications
The OpenStreetMap diary is designed for sharing experiences and knowledge related to the mapping community, so technical and mapping-focused articles are a much better fit than unrelated promotional content.
Conclusion
Maps provide a powerful way to add geographic context to digital applications.
By combining sports information, structured datasets, geographic coordinates, and interactive maps, developers can build useful applications for exploring venues and location-based information.
OpenStreetMap demonstrates how open geographic data and community contributions can support a wide range of mapping projects. A technology-focused diary entry about mapping, data, or a genuine mapping project can therefore contribute something useful to the OpenStreetMap community.
OpenStreetMap is particularly interesting because its map data is created and maintained by a global community. The OpenStreetMap website also provides user diaries where contributors can share experiences, technical topics, mapping activities, and community projects.
Why Location Data Matters
Location can add useful context to many types of digital information.
A web application can associate information with:
Cities Regions Roads Buildings Sports venues Businesses Public facilities Transport networks
For example, a sports-information application could use geographic data to identify the locations of stadiums and other sporting facilities.
Mapping Sports Venues
Sports data and geographic data can be combined to create interesting applications.
A simple dataset might contain:
Field Description Venue Name of the sports venue City Location of the venue Country Country where it is located Latitude Geographic latitude Longitude Geographic longitude Sport Sport associated with the venue
This information could then be displayed on an interactive map.
OpenStreetMap Data
OpenStreetMap provides geographic data that can be used in many mapping applications, subject to its data licence and attribution requirements.
A developer can use map data to create applications for exploring roads, buildings, landmarks, transportation infrastructure, and other mapped features.
The OpenStreetMap ecosystem also provides tools and editors that allow contributors to improve geographic information.
A Simple Web Application Concept
A location-based sports application could follow this structure:
Sports Data ↓ Venue Database ↓ Geographic Coordinates ↓ Mapping API / Map Library ↓ Interactive Web Map
A user could select a sport and view relevant venues on a map.
Using Geographic Coordinates
Each venue can be represented using latitude and longitude.
For example:
const venue = { name: “Example Stadium”, latitude: 19.0760, longitude: 72.8777 };
A mapping library can then use these coordinates to place a marker on an interactive map.
Combining Data and Maps
The combination of structured data and maps can create useful visualizations.
For example, a project could display:
Sports venues by city Number of venues by region Distribution of facilities Distance between venues Transportation connections Geographic coverage
These visualizations can help users understand geographic patterns that are difficult to see in a conventional table.
Responsible Use of Geographic Information
When building location-based applications, developers should also consider privacy and accuracy.
Personal addresses or other sensitive location information should not be published without an appropriate reason and permission.
For public mapping projects, contributors should focus on accurate geographic information and follow OpenStreetMap’s community and contribution guidelines.
Learning From OpenStreetMap
OpenStreetMap provides an interesting environment for developers who want to learn about:
Geographic information systems Open data Mapping APIs Web development Data visualization Community mapping Location-based applications
The OpenStreetMap diary is designed for sharing experiences and knowledge related to the mapping community, so technical and mapping-focused articles are a much better fit than unrelated promotional content.
Conclusion
Maps provide a powerful way to add geographic context to digital applications.
By combining sports information, structured datasets, geographic coordinates, and interactive maps, developers can build useful applications for exploring venues and location-based information.
OpenStreetMap demonstrates how open geographic data and community contributions can support a wide range of mapping projects. A technology-focused diary entry about mapping, data, or a genuine mapping project can therefore contribute something useful to the OpenStreetMap community.
Ive now uploaded to the Internet a little web-based program called GPX Reference Point Generator (GPXRPG).
New flock alprs are appearing in neighborhoods near where I go to college. This is scary, do your part.
- ᵈⁱˢᵗᵃⁿᶜᵉᵈ
I’m undergoing the learning path “Open Mapping Essentials” on HOT´s learning centre. In the process I have contributed by mapping local businesses and housing buildings in Managua. I also added a few rural roads in the Esteli area. All my changes are based on local knowledge of the areas. I am looking forward to contributing to the OSM and HOT communities.
Learning Path
Im undergoing the learning path Open Mapping Essentials on HOT´s learning centre. In the process I have contributed by mapping local businesses and housing buildings in Managua. I also added a few rural roads in the Esteli area.OpenStreetMap
Hi guys.
I would like to emphasize the benefit that the micromapping of certain features can contribute to unhoused communities. Of course, there still needs to be more awareness of OSM within these communities, but the data being there is great for the future and making the map more useful.
Tagging if the seats on benches are separated or not allows people to know where they are able to lay down and thus sleep if they don’t have access to other places to sleep. The tag seats:separated=yes/no is used for this purpose. Ive been adding this to every bench I map. Tagging benches that are not separated is just as important as tagging benches that are.
Drinking water is needed for all humans to live. Knowing where the nearest water fountain is, or the nearest convenience store that will let you fill up a water bottle from their fountain drink dispensers, can be super useful and help when times are tough. Consider looking out for drinking fountains at parks and other public places.
Hope you got something from this, happy mapping and I hope you have a nice day.
I would like to emphasize the benefit that the micromapping of certain features can contribute to unhoused communities. Of course, there still needs to be more awareness of OSM within these communities, but the data being there is great for the future and making the map more useful.
Tagging if the seats on benches are separated or not allows people to know where they are able to lay down and thus sleep if they don’t have access to other places to sleep. The tag seats:separated=yes/no is used for this purpose. Ive been adding this to every bench I map. Tagging benches that are not separated is just as important as tagging benches that are.
Drinking water is needed for all humans to live. Knowing where the nearest water fountain is, or the nearest convenience store that will let you fill up a water bottle from their fountain drink dispensers, can be super useful and help when times are tough. Consider looking out for drinking fountains at parks and other public places.
Hope you got something from this, happy mapping and I hope you have a nice day.
This diary entry explores how modern web technologies can create accessible and responsive digital sports experiences. It looks at user-friendly navigation, mobile-responsive layouts, organized sports information, interactive interface elements, and the role of technology in connecting online communities. The project focuses on design and digital experience while considering how clear and reliable information can improve the way users explore online platforms.
Digital platforms increasingly combine maps, data, and responsive web interfaces to help people access information from different devices.
OpenStreetMap is an interesting example of how an open mapping community can collaboratively create and maintain geographic data. Users can contribute mapping information, discuss changes, and document their mapping activities through user diaries.
From a web-development perspective, mapping platforms demonstrate the importance of responsive interfaces, clear navigation, structured information, and community participation.
My interest in this area is focused on understanding how modern web technologies can present large amounts of information in a simple and accessible way.
Community-driven projects also show how technology can bring contributors together to improve publicly available information.
OpenStreetMap is an interesting example of how an open mapping community can collaboratively create and maintain geographic data. Users can contribute mapping information, discuss changes, and document their mapping activities through user diaries.
From a web-development perspective, mapping platforms demonstrate the importance of responsive interfaces, clear navigation, structured information, and community participation.
My interest in this area is focused on understanding how modern web technologies can present large amounts of information in a simple and accessible way.
Community-driven projects also show how technology can bring contributors together to improve publicly available information.
On August 12th, 2025, I made my first edit to OpenStreetMap. It has now been exactly one year since I began editing. Here are some of the coolest things I’ve done in my relatively small amount of time spent on this hobby:
I hope to be an active contributor for years to come and meet tons of mappy people like me!
3,095 changesets
226486 contributions
Added a “surface=” tag to every primary road, trunk road, and motorway in Virginia
Made changes in 64 countries
Procrastinated mountains of homework
I hope to be an active contributor for years to come and meet tons of mappy people like me!
It's Been 1 Year...
On August 12th, 2025, I made my first edit to OpenStreetMap. It has now been exactly one year since I began editing. Here are some of the coolest things Ive done in my relatively small amount of time spent on this hobby:OpenStreetMap
Ive now uploaded to the Internet a little web-based program called GPX Reference Point Generator (GPXRPG).
For tomorrow’s eclipse I built a small free tool that reconstructs the ground-level view anywhere in the visibility zone, with buildings and forests from OSM extruded over real terrain, and the eclipse computed minute by minute. I posted the technical details on the community forum this week. The tool is at 2026eclipse.eu. Feedback on how your area renders is very welcome, especially where height tagging is sparse.
A solar eclipse simulator built on OSM data
For tomorrows eclipse I built a small free tool that reconstructs the ground-level view anywhere in the visibility zone, with buildings and forests from OSM extruded over real terrain, and the eclipse computed minute by minute.OpenStreetMap

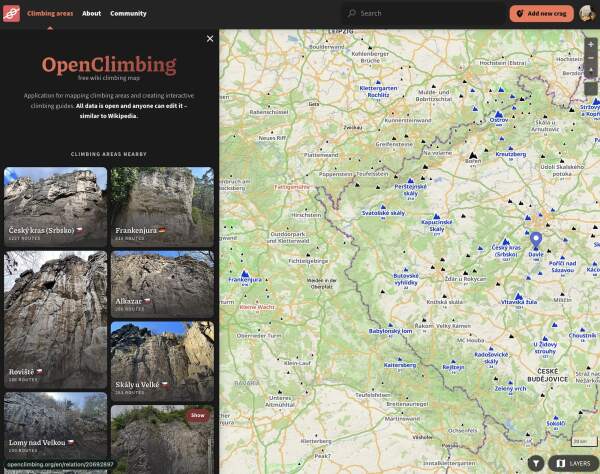
Imagine opening a map and finding almost everything you need for climbing in one place: areas, crags and routes, grades in your preferred system, topo photos, rock type, sun and shade – together with your own ascents and projects.
Hello guys, It’s me, plato59 and I realized that I am 76th place in Edits of the Philippines for August 10, 2026 according to OSMstats
I went to miles farm today. 8/10/2026
No new street developments. Mostly just new houses
No new street developments. Mostly just new houses
A while back a message popped up in my inbox inviting me to compete for a GoPro Max2 360-degree sport camera, courtesy of Meta, which of course now owns Mapillary and thus has a vested interest in supporting crowdsourced collection of street-level im…
I build bike + train loops in France by crossing OpenStreetMap with the official cycling-route reference (ONV / Réseau vélo et marche).
Today I finished mapping all the homes in the Stonebrae Country Club, a gated community surrounding a golf course at the top of the loop where Fairview Avenue becomes Hayward Avenue. In 2010 I worked as a NARFU Census taker and had to note down which addresses were inhabitable because they hadn’t been built yet. Now all that land with just paved streets are homes. Many of my children’s friends live there as they attended the elementary school across the street from the outer bounds of the neighborhood.
Next step is to start my way down Hayward Avenue and eventually into the heart of the city.
Next step is to start my way down Hayward Avenue and eventually into the heart of the city.
A car dealer of used and new cars , Held car mela in every sunday “Madni Car Mela Pattoki” at Madni Motors Pattoki
I have already forgotten how I first came across StreetComplete, but what I do remember is that I immediately fell in love with the concept of the app.
I like wandering around and exploring. When travelling, the things that attract me the most are actually very “normal”. Maybe there is a neighbourhood, maybe a lovely park, maybe a path along the river… I just follow the direction of the road and take a turn at a junction if I feel like it.
I don’t know. I just really don’t like those crowded and buzzing tourist attractions. On the contrary, it is in the nooks and crannies of everyday life that I can feel the vibe of a neighbourhood, a town, or a city.
This convenience store has some good samosas. This small community park offers the best shade during the scorching summer. This path along the canal has ducks and geese to guide your walk…
From these small and seemingly negligible things, I feel a city comes alive.
And that’s why StreetComplete is my best travel companion. It pulls up a bunch of quests for me to explore. The surface of the pavement, the sound signal at a crossing, the bin at a bus stop, the name of a store… It simply guides me to dive deeper into an area, and I can explore while completing the quests along the way.
Gamification is a good way to encourage contributions to OSM, but for me, StreetComplete is far more than just a game. It lets me immerse myself into a city and teaches me how to look at it from a new perspective.
I like wandering around and exploring. When travelling, the things that attract me the most are actually very “normal”. Maybe there is a neighbourhood, maybe a lovely park, maybe a path along the river… I just follow the direction of the road and take a turn at a junction if I feel like it.
I don’t know. I just really don’t like those crowded and buzzing tourist attractions. On the contrary, it is in the nooks and crannies of everyday life that I can feel the vibe of a neighbourhood, a town, or a city.
This convenience store has some good samosas. This small community park offers the best shade during the scorching summer. This path along the canal has ducks and geese to guide your walk…
From these small and seemingly negligible things, I feel a city comes alive.
And that’s why StreetComplete is my best travel companion. It pulls up a bunch of quests for me to explore. The surface of the pavement, the sound signal at a crossing, the bin at a bus stop, the name of a store… It simply guides me to dive deeper into an area, and I can explore while completing the quests along the way.
Gamification is a good way to encourage contributions to OSM, but for me, StreetComplete is far more than just a game. It lets me immerse myself into a city and teaches me how to look at it from a new perspective.
Is You Now We Started Adding A Lot Of New Stuff And Changes To R 8 Side And R 16 Side. R 8 Side Will Be Done At Aug 29th And R 16 Side Will Be Done On Last Day Of Sep.
··· I didn’t start contributing to OSM because of any grand philosophy or ideology. I simply began editing because I needed to.
Over the past year, our OpenStreetMap Pakistan community has been actively working to map high-risk flood zones across the country—both areas historically affected by extreme flooding and regions facing critical vulnerability during upcoming monsoon …
This afternoon, I noticed that several of my colleagues were visiting a recently opened school in the far south.
I’m on my mobile phone, and l find it the most useful tool. If l must work on OSM from the laptop, l’d have to do it offline. For that, l’d have to download the josm offline map, after locating the coordinates.
05/08/’26 01:18
05/08/’26 01:18
First Time on OSM Database
Im on my mobile phone, and l find it the most useful tool. If l must work on OSM from the laptop, ld have to do it offline. For that, ld have to download the josm offline map, after locating the coordinates.OpenStreetMap
Life in a multi-million population City can be tough on Introverted minds. For me, mapping in OpenStreetMap is first and foremost an activity to improve publicly accessible geodata around my local and known places, though it has also recently become …
Life in a multi-million population City can be tough on Introverted minds. For me, mapping in OpenStreetMap is first and foremost an activity to improve publicly accessible geodata around my local and known places, though it has also recently become …
August 2–8
August 2
- Fixed Reynoldsburg borders; borders now up-to-date as of most recent annexation on May 24, 2026.
- Updated Reynoldsburg population; increased to 43,350 according to U.S. Census Bureau.
- Added intermittent stream called Little Jordan Run.
- Modified Jackson Avenue; changed “one way” value to “no” and added note that signage by the Street Department is incorrect. Correct name is Jackson Avenue not Jackson Street.
- Modifed Burkey Avenue; changed “one way” value to “no” and added note that signage by the Street Department is incorrect. Correct name is Burkey Avenue, not Burkey Drive.
- Modified Burkey Court; switches from Burkey Avenue to Burkey Court at the intersection with Southwood Avenue, not in the middle of the road.
- Fixed name of Taylor Park Drive (originally shown as just “Taylor Park”).
- Fixed differentiation between Taylor Road and Taylor Road Southwest.
- Added info to Raider Stadium (Reynoldsburg High School football stadium).
- Removed Smokey Bones brand from building at 2200 Baltimore-Reynoldsburg Road (closed permanently after bankruptcy).
- Added info to Reynoldsburg High School’s Livingston Campus.
To-do: Add bus route 42 stops through Highton and Belmont. Will be referring to McHarry’s route map and ensuring match with Transport Victoria resources.
Bus Route 42, Geelong Station to Deakin University via South Valley Rd.
To-do: Add bus route 42 stops through Highton and Belmont. Will be referring to McHarrys route map and ensuring match with Transport Victoria resources.OpenStreetMap
I am currently focusing my mapping work on the Taiping Heritage Zone. Most of the shoplot footprints and major buildings have been completed, and I am now working on detailed micromapping for schools, museums, and government buildings.
Please feel free to contribute by adding any missing information, such as shop or stall names, building levels, address numbers, or other relevant details that I may have missed.
Let’s work together to make Taiping one of the most complete and detailed small-town maps in Malaysia on OpenStreetMap.
Please feel free to contribute by adding any missing information, such as shop or stall names, building levels, address numbers, or other relevant details that I may have missed.
Let’s work together to make Taiping one of the most complete and detailed small-town maps in Malaysia on OpenStreetMap.
As explained in this french diary entry I left a bunch of notes, took a bunch of traces while visiting Mongolia in July.
Upgraded from the Max to the Max2. Going to publish my settings here so it’s easier for me to find.
Still need to test and figure out the settings. I currently use a dash cam for a car and I don’t have an exterior mount for my GoPro. Dash cam I use is an AZDOME GS63H. Very simple to use and great quality images. And one of the few dash cams that work with Mapillary for less than $100. I got mine on Ebay for about $50.
Walking
- Same settings as Bicycle Settings below, except set the Interval to 1 or 2 seconds depending on walking speed. 2 if casually walking, 1 if brisk.
- Very important: Use a selfie stick and hold camera at least 6 inches above head to capture better images. The higher the better.
Bicycle, My main method of capturing imagery. Most tested.
- Time Lapse 360 Video
- Resolution 8K
- Interval 0.5 Seconds
- Bit Depth 10-Bit
- EV Comp 0
- ISO Min 100
- ISO Max 800
- Color Natural
- Sharpness Low
- Denoise Low
- Bit Rate Max
Car
Still need to test and figure out the settings. I currently use a dash cam for a car and I don’t have an exterior mount for my GoPro. Dash cam I use is an AZDOME GS63H. Very simple to use and great quality images. And one of the few dash cams that work with Mapillary for less than $100. I got mine on Ebay for about $50.
GoPro Max2 Settings
Upgraded from the Max to the Max2. Going to publish my settings here so its easier for me to find.OpenStreetMap
According to the Alaska Department of Fish and Game, there are over three million lakes in Alaska with a surface area larger than five acres!
One day, in a certain neighborhood, there was a heated discussion about naming an unnamed road.
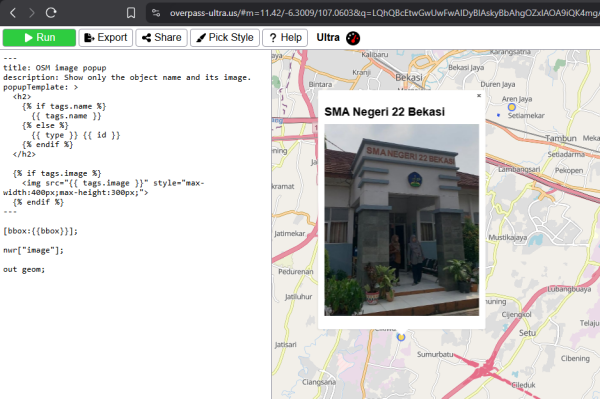
If youre new to OpenStreetMap (OSM), writing Overpass queries from scratch can seem intimidating. Fortunately, Overpass Turbo provides a built-in Wizard that generates queries automatically based on simple search phrases.